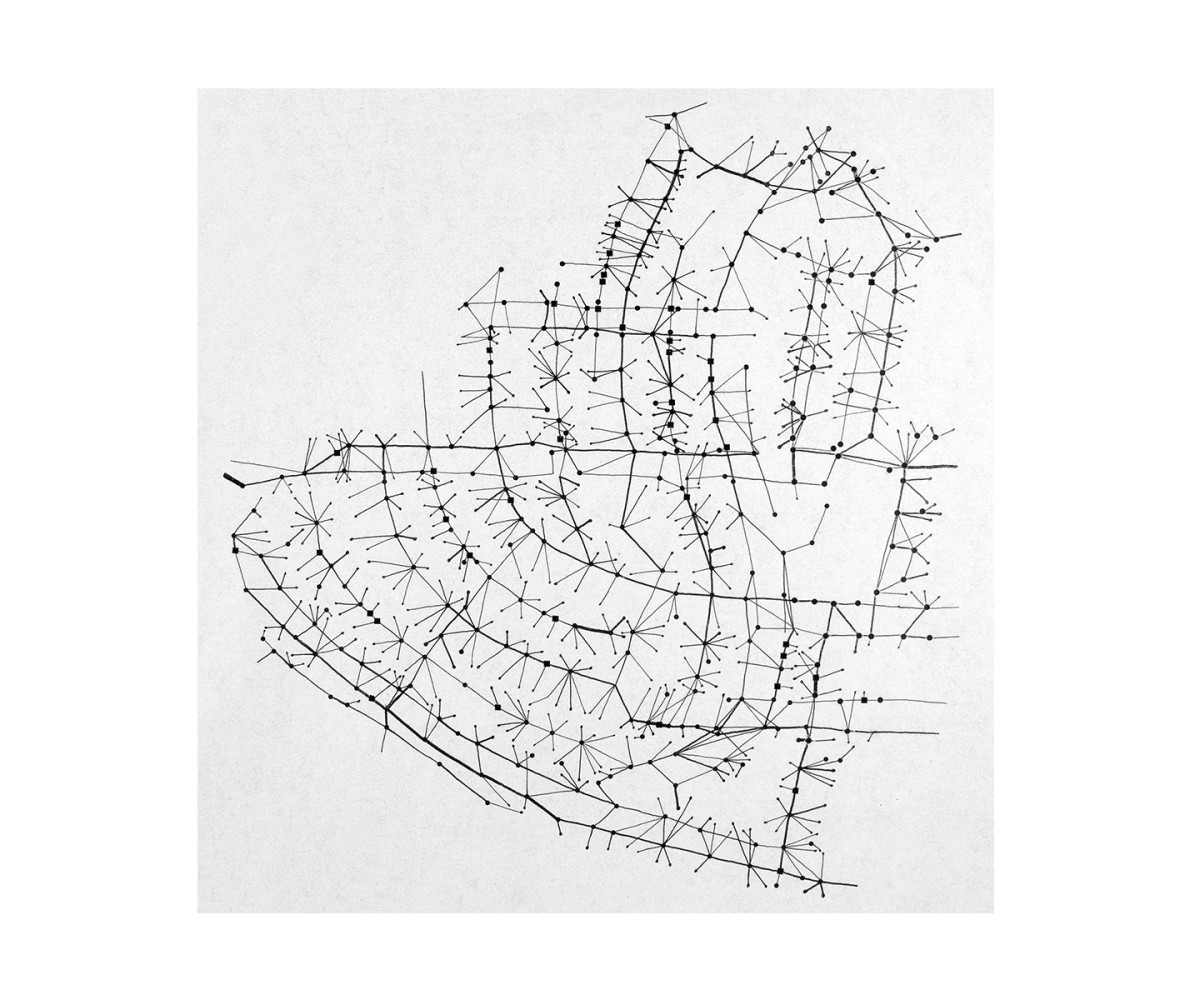
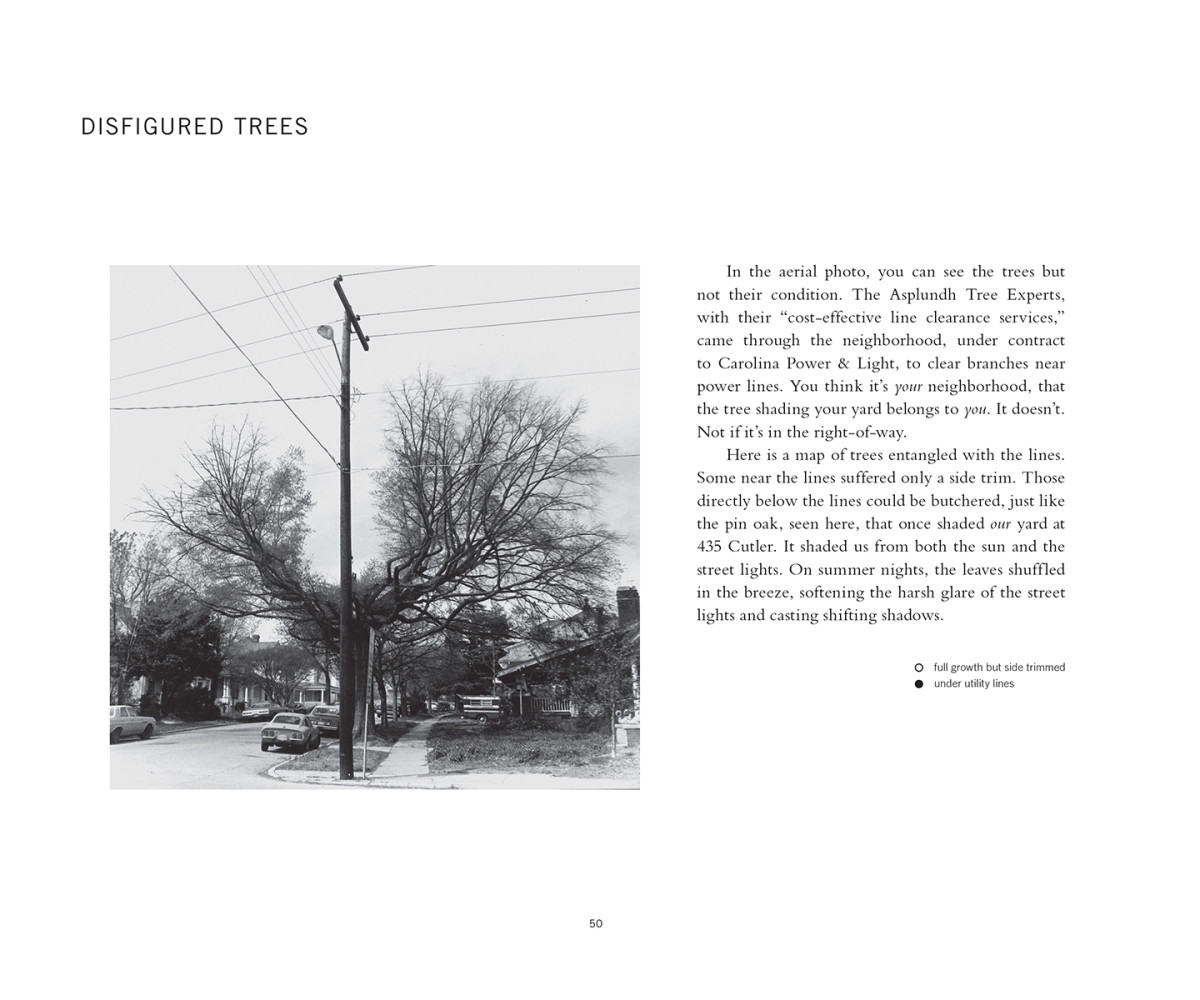
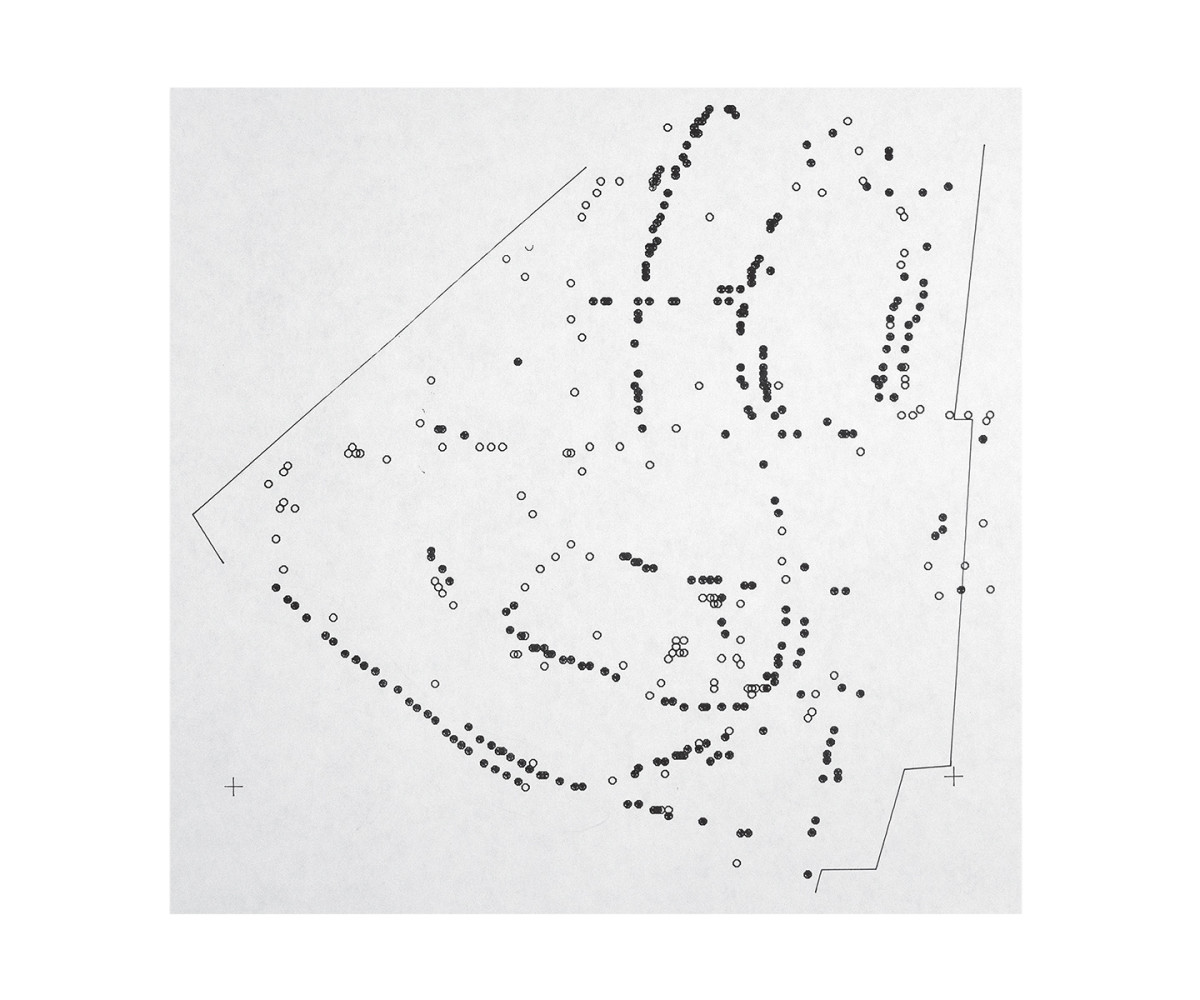
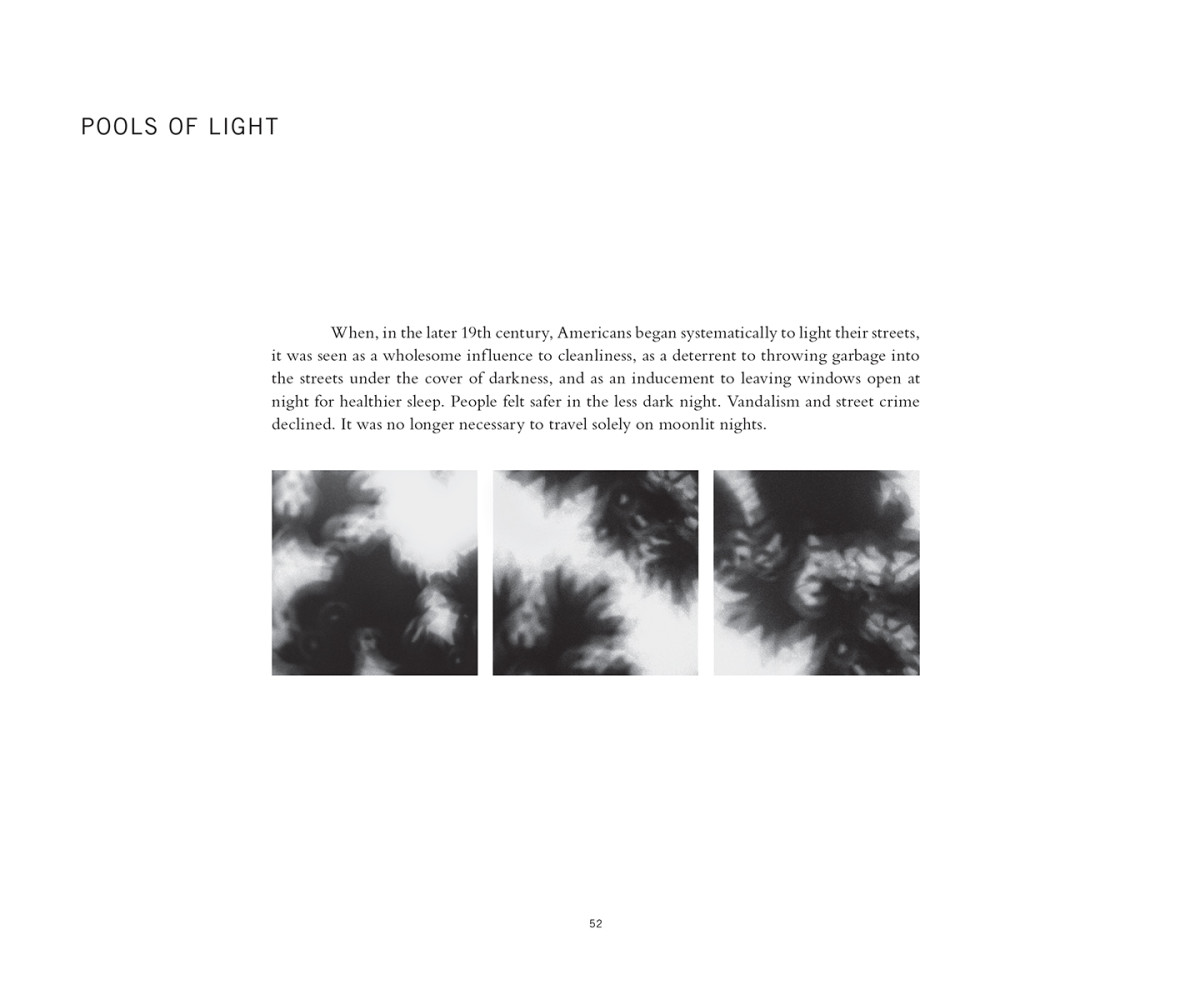
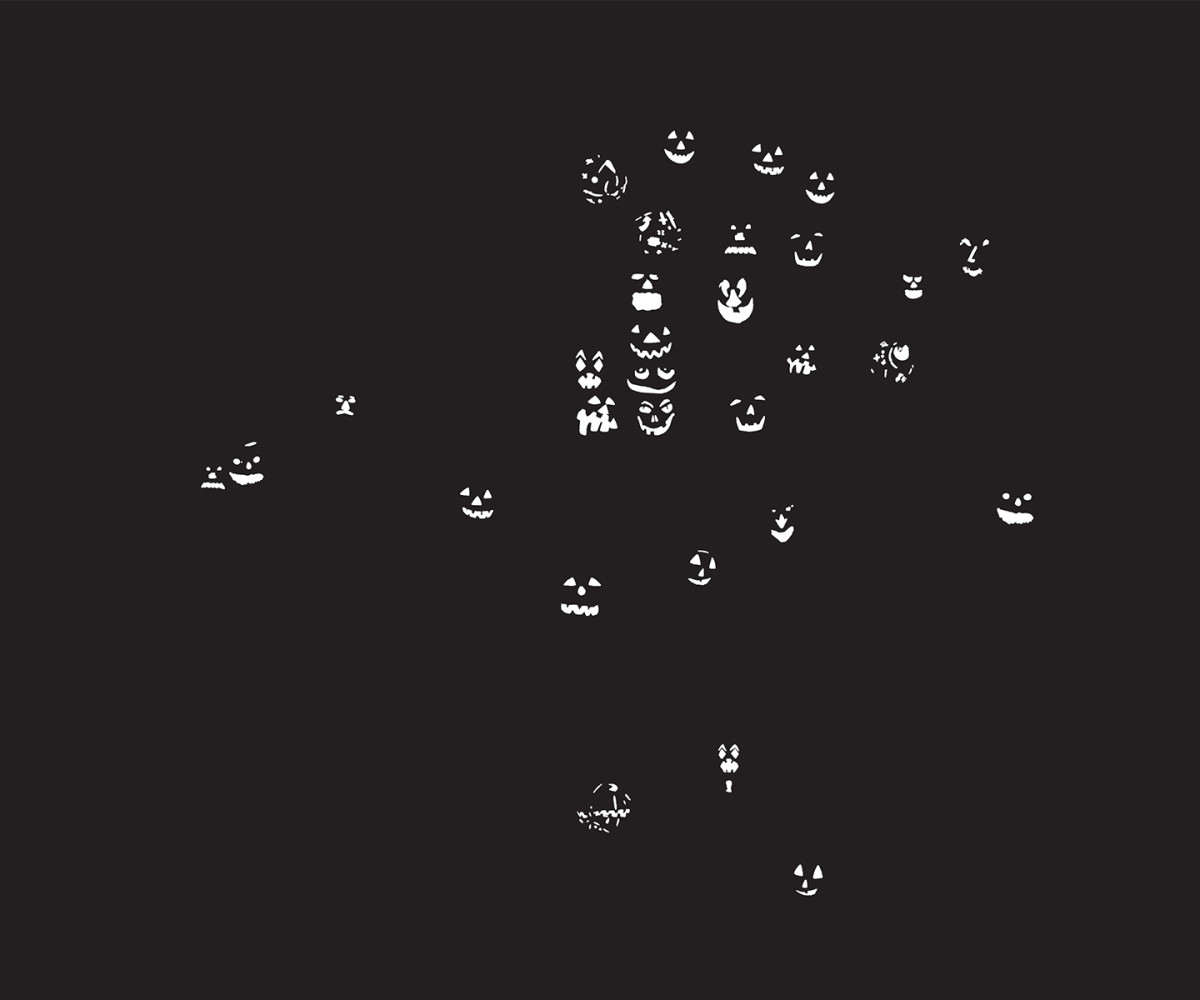
"Newsletter Prominence" from Everything Sings: Maps for a Narrative Atlas by Denis Wood, 2nd edition, Siglio, 2013, © the author and Siglio.
—Interview published courtesy of Siglio Press.
Blake Butler: What about your colleagues in the world of mapmaking—is there a big clash between you and more traditional geographers who are making maps to sell in books of data?
Denis Wood: Many people don’t like my insistence—which goes back into the very early 1980s—that maps are political, that maps exhibit and promote a political orientation. They’re about something. They have an agenda. There are a lot of mapmakers who really object to that. And this is in 2011, when my colleagues and I have been at this critical thing now for twenty years, and it has largely been accepted. It’s the new cartographic dogma that maps have perspectives and make arguments and things like that. But when I say that maps aren’t representations at a meeting of cartographers, it’s very usually the case that the first person who stands up to ask a question says, “How can you say that maps aren’t representations?”
Also, a lot of [cartographers] don’t want to acknowledge any complicity with the way things are, and maps have a huge deal to do with the way things are. They want to pretend their hands are clean: maps are just a tool. But you can do bad things with a tool and you can go good things with a tool. I’ve been suggesting to the hardest-edged people of all that they could put their epistemological and ontological arguments on a really firm foundation by simply acknowledging the fact that they are making the world. And they recoil from that, viscerally and instinctively, as they continue to make the software that enables them to make the world. In explicit terms, some of the most brilliant analyses of how maps do what they do have been carried out by these people who are basically building machines to make maps. When someone drops a bomb on something and kills a bunch of kids, and they do that using a map that you made, you either accept the responsibility for it—a kind of well, you can’t make an omelet without breaking some eggs responsibility—or you say, “Damn it, I can’t do this anymore.”
Blake Butler: The maps you make in Everything Sings exist on a more personal terrain than a war map. I wonder whether the process was ever potentially emotional for you. I imagine a map could even be terrifying, even revealing certain things based on information you collected, about this place where you lived.
Denis Wood: The problem with making the map is that by the time you’ve decided, “This is something that constitutes data,” and you’ve collected it, and you’ve massaged it to the point where you can make a map out of it, you already know the worst that’s going to come out of the map. When you’re working at the scale I’m working at, you’ve already decided up front that you’re going to record locations of wind chimes. Now, it might be somewhat of a revelation to actually map them out, but it’s not going to be shocking or anything.
But I’ve seen maps that I find completing terrifying. Maps of uranium mining and of various illnesses in the Navajo reservations—they’re just insane. They just make you furious. Bill Bunge’s map—which I still think is one of the great maps, the map of where white commuters in Detroit killed black children while going home from work—that’s a terrifying map, and that’s an amazing map. He knew that. They had to fight to get the data from the city. They had to use political pressure to get the time and the exact location of the accidents that killed these kids. They knew what they were looking for. I didn’t have anything to do with that project, so when I saw the map for the first time, it was like, “Oh my god.” It’s so powerful to see maps like that. That’s the power of maps, or one of the powers of maps: to make graphic—and at some level unarguable—some correlative truth. We all knew that people go to and from work. But to lay the two things together reveals something horrible.
Maps are just nude pictures of reality, so they don’t look like arguments. They look like “Oh my god, that’s the real world.” That’s one of the places where they get their kick-ass authority.
Blake Butler: It’s an argument, like you said.
Denis Wood: It sure as hell is. Maps are just nude pictures of reality, so they don’t look like arguments. They look like “Oh my god, that’s the real world.” That’s one of the places where they get their kick-ass authority. Because we’re all raised in this culture of: if you want to know what a word means, go to the dictionary; if you want to know what the longest river in the world is, look it up in an encyclopedia; if you want to know where some place is, go to an atlas. These are all reference works and they speak “the truth.” When you realize in the end that they’re all arguments, you realize this is the way culture gets reproduced. Little kids go to these things and learn these things and take them on, and they take them on as “this is the way the world is.”
Blake Butler: It’s interesting the way the interpretive layers that aren’t pictured or quantified on the map exist there to be uncovered.
You were tied into the culture or you weren’t: you saw the pictures, you made the paste-up things in elementary school, you paid attention, or you didn’t—and if you didn’t, then you didn’t know how to carve a pumpkin face. That’s what I was looking at in this map: marginality.
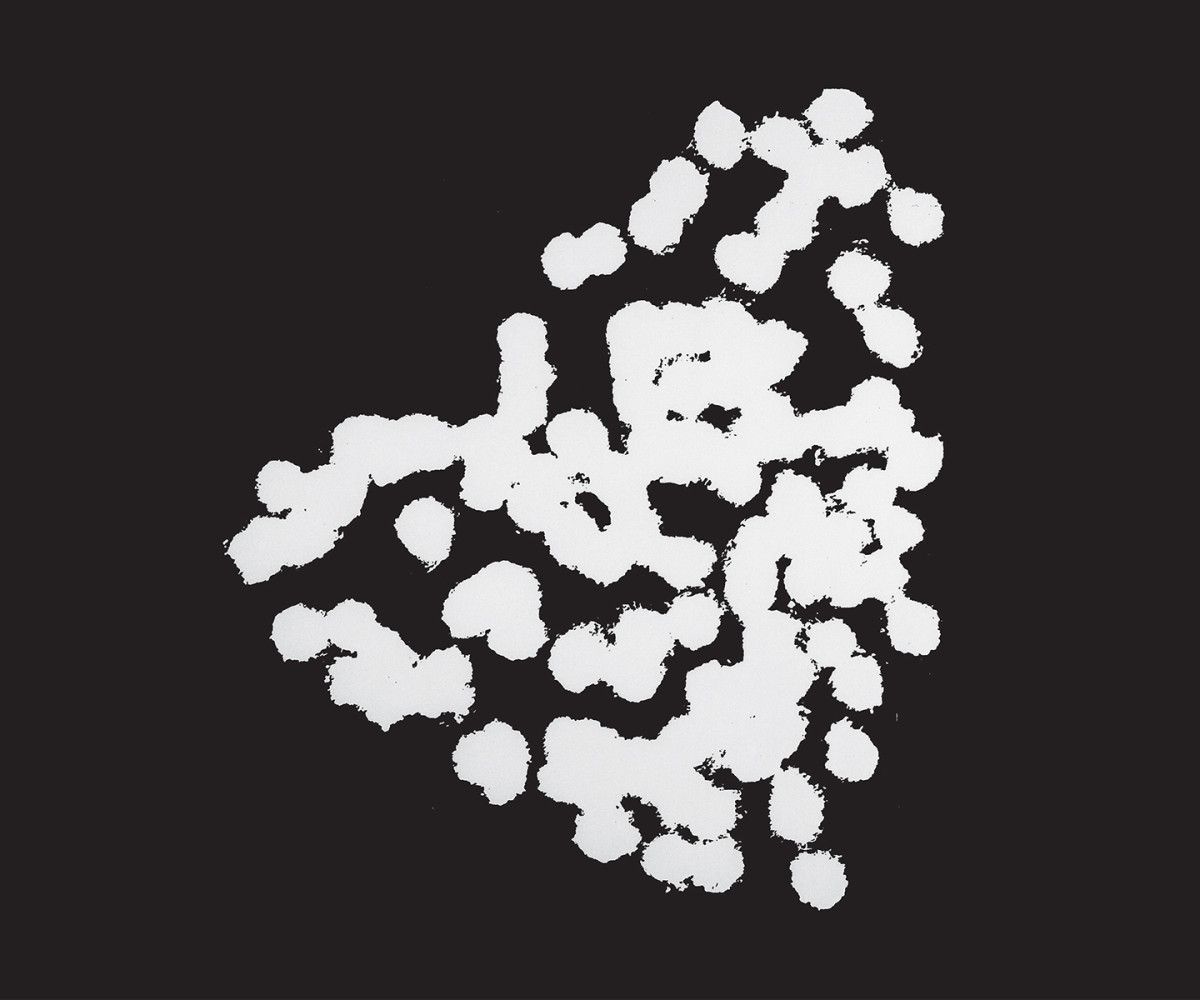
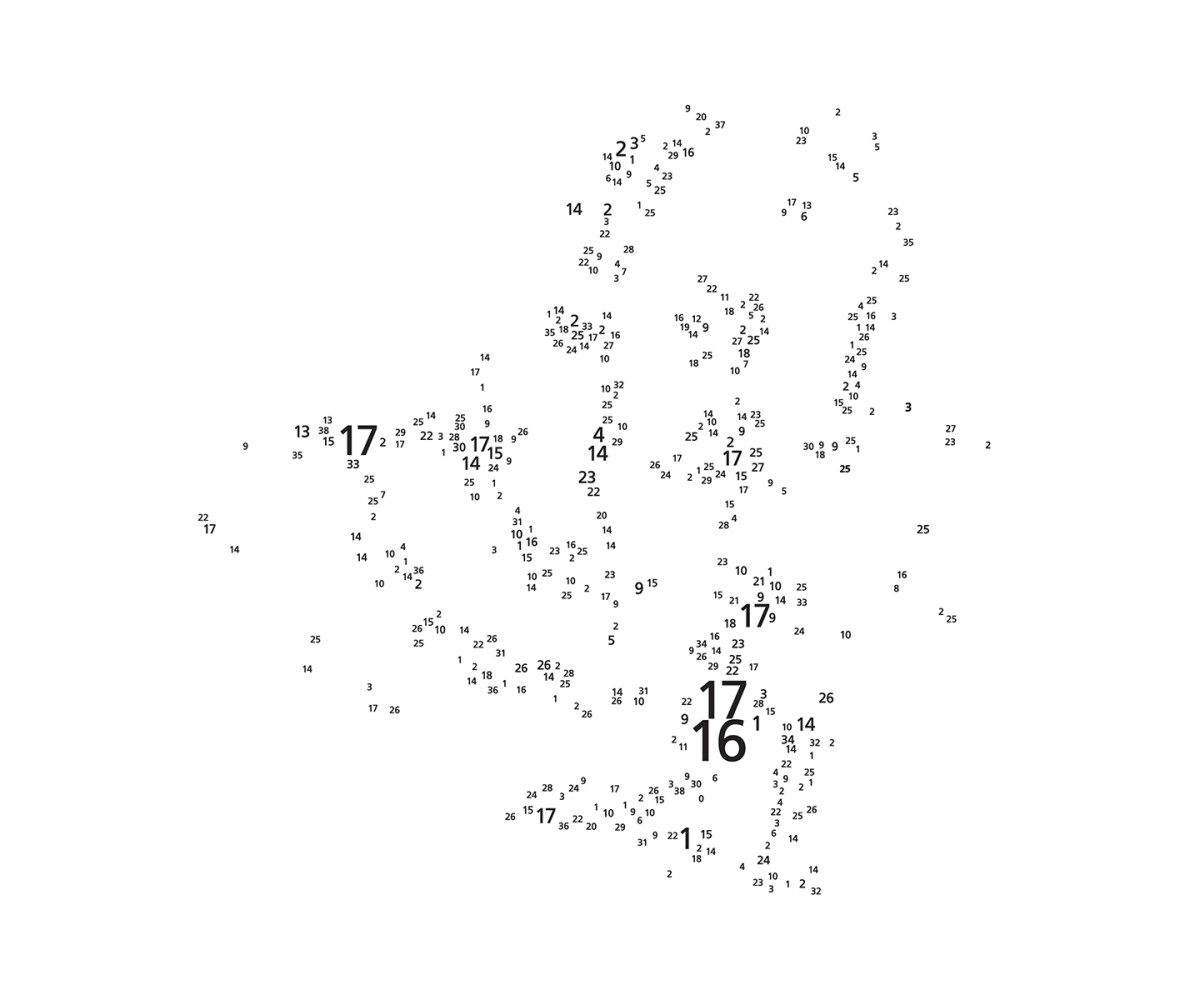
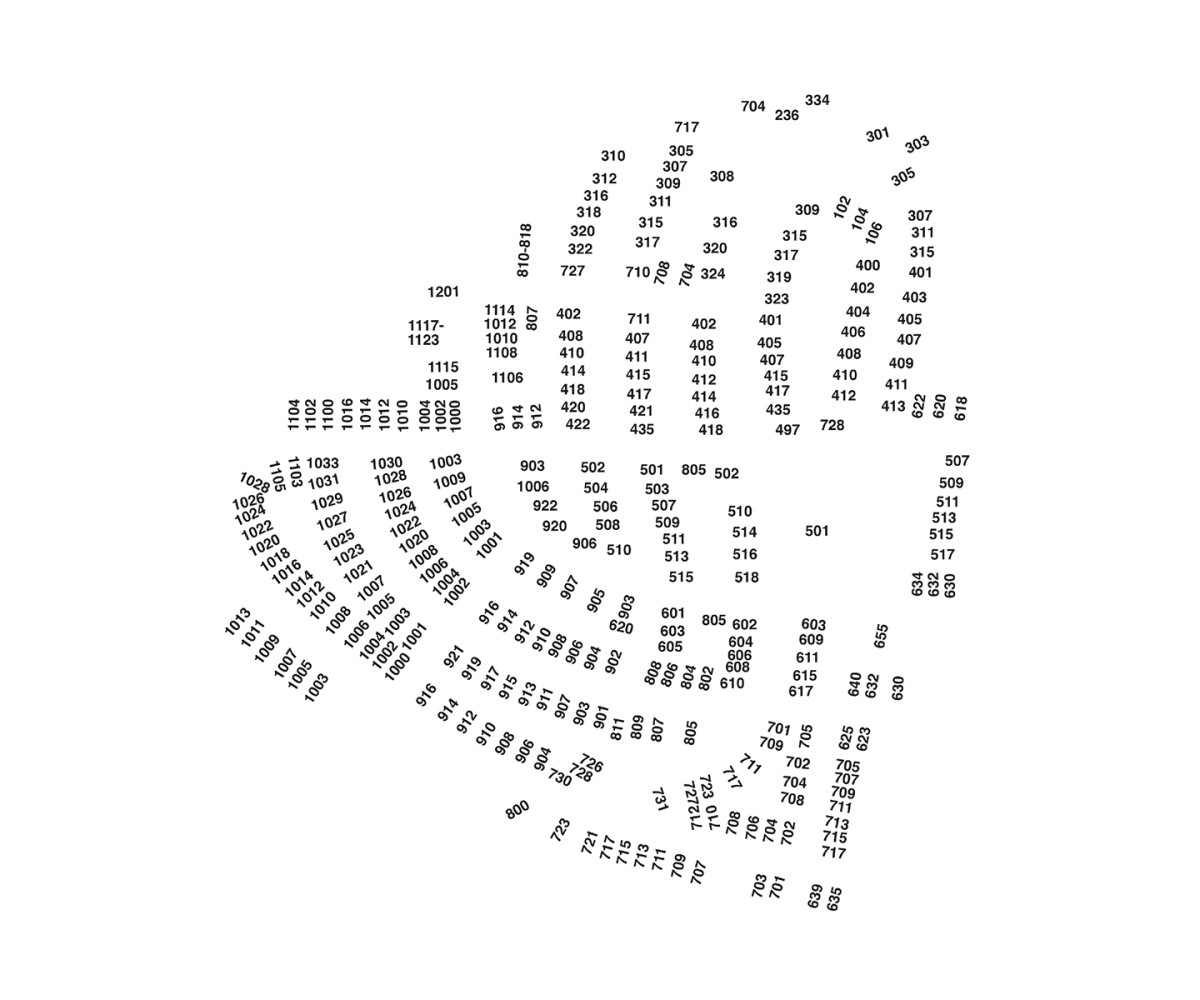
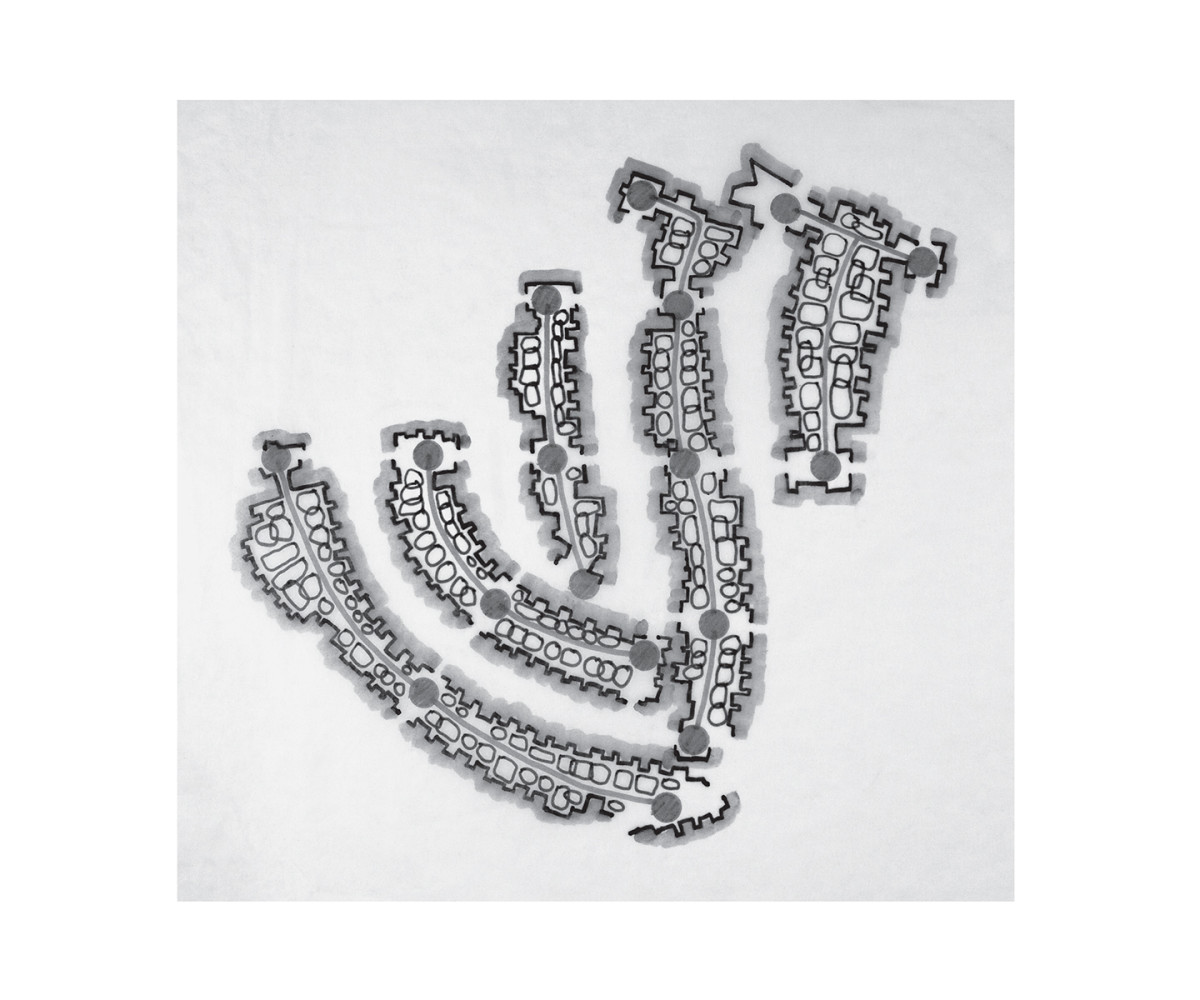
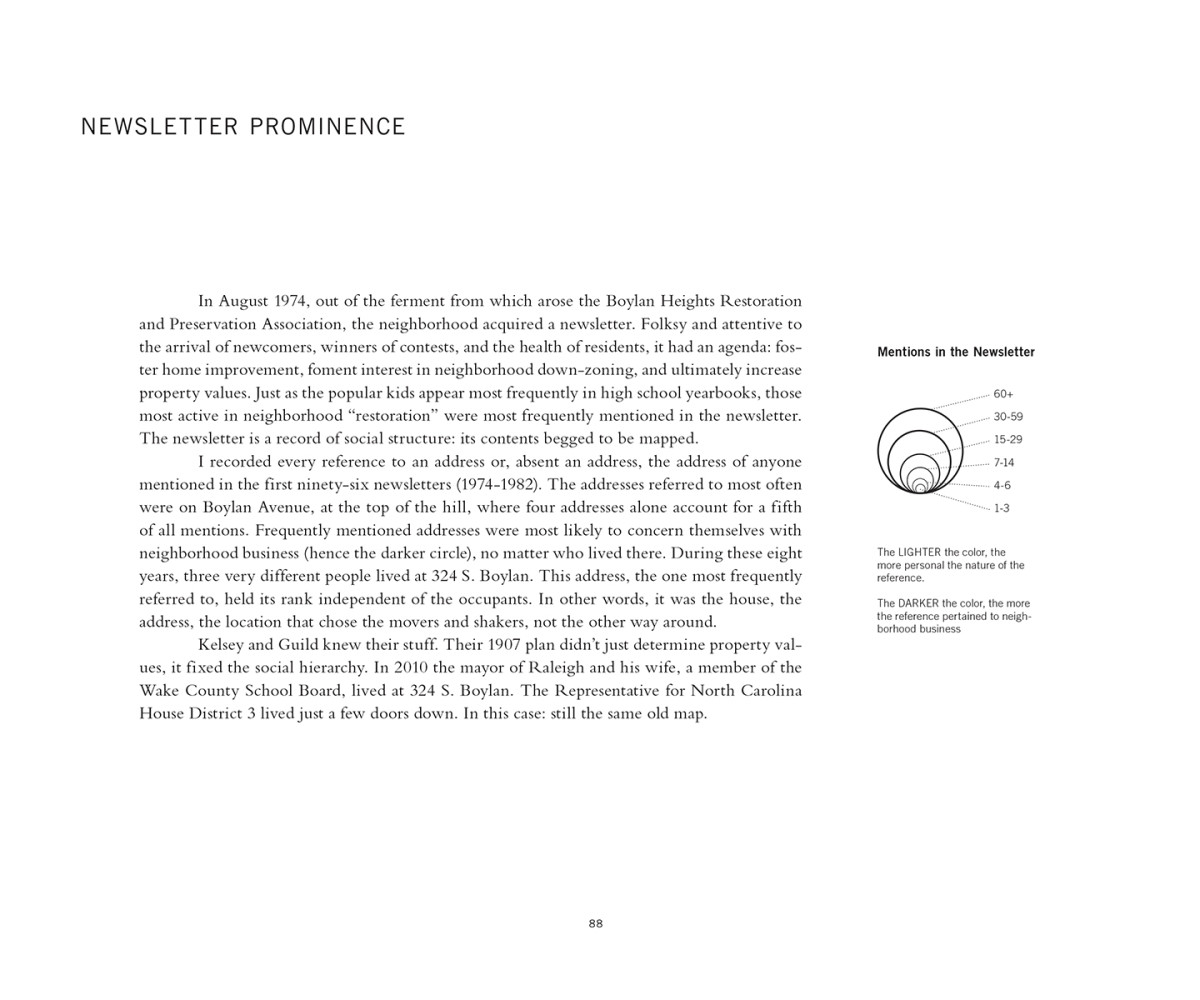
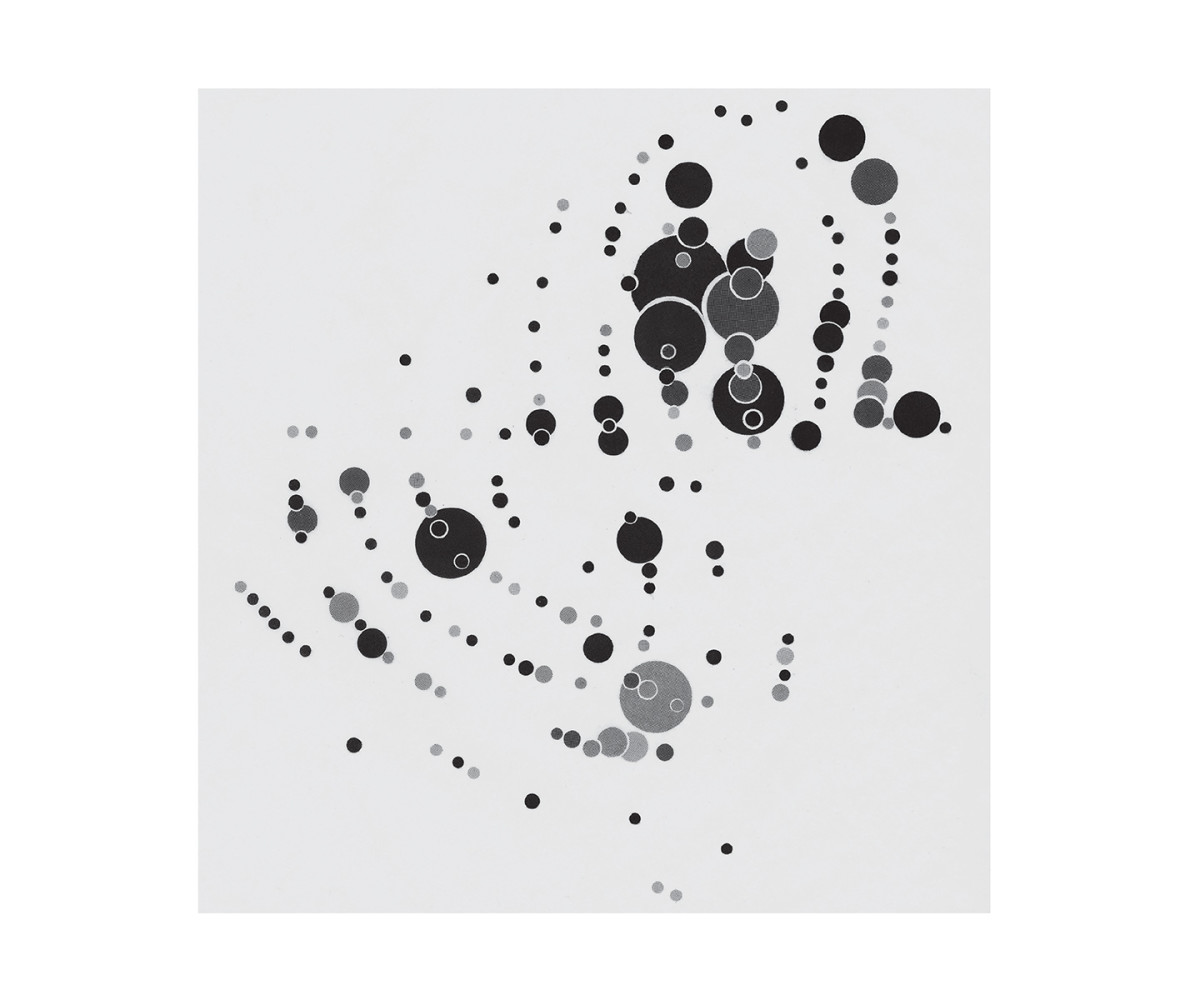
Denis Wood: There are a thousand stories for almost every one of these plates. For instance, in order to get the photographs for the pumpkin map, I had to whip through the neighborhood on my bicycle because otherwise it gets too late—the candles go out or the people go in. So I’m on my bike at the eastern edge of the neighborhood, and I need to know what time it is. I ask this young guy in a phone booth, “Do you know the time?” He says, “Oh man, it’s 8:30. I’m carving this pumpkin, it’s probably too late.” And I said, “Carving this pumpkin?” [Laughs.] That was really interesting. I’d photographed almost the entire neighborhood; this was the edge. He invited me to see his pumpkin, so we go to his house, and there’s no pumpkin on the porch, there are no Halloween decorations, there’s no sign that if anybody knocked on the door they’d have anything to give them. I park my bike, we go into the kitchen, and he’s got the pumpkin sitting on the drain board of the sink. He’s carved out a mouth and a nose, but he can’t figure out which direction the eyes go. That cultural cue isn’t somehow built into him, and he’s paralyzed. He’d left the house to call a friend to find out how he should make the eyes. I knew there was a concentration of pumpkins around the part of the neighborhood that I lived in, but I didn’t realize until then that there were big spots in the neighborhood without a single pumpkin. When I met this guy, I realized that the pumpkin was, in a way, a representation of cultural capital of some kind. You were tied into the culture or you weren’t: you saw the pictures, you made the paste-up things in elementary school, you paid attention, or you didn’t—and if you didn’t, then you didn’t know how to carve a pumpkin face. That’s what I was looking at in this map: marginality. Then, when I made the map of how many times different addresses were mentioned in the community newsletter, I said, “Oh my god, the marginal pumpkin areas are precisely the areas marginally mentioned in the newsletter.” And guess what? They correlated perfectly to assessed property values and the Kelsey and Guild plan to lay out a neighborhood with stratified class structure. All of these things just piled up. There were a lot of keys to open various portals, and one of them was running into this kid who couldn’t figure out whether to make the eyes go up or down. And we all know the eyes go up. [Laughs.]
I think mapping things is usually good. It lets sunshine in, though I suppose there plenty of microbes that don’t like the sun.
Blake Butler: Is there anything you think of as unmappable?
Denis Wood: To map something meaningfully, it has to have some kind of areal expression. It can’t be uniformly dispersed in space. The USGS maps everything in the United States and it doesn’t matter. There’s a famous USGS sheet—maybe there’s more than one—devoted to the Great Salt Lake. It’s completely blue. There’s not a differentiating mark whatsoever. It’s just water, right? That’s obviously preposterous. Only somebody obsessively compiling the universe would produce a map like that. If the phenomenon is differentiated spatially, then it can be mapped. And if it can be mapped, I guess the question would be: Can you find and collect the data that would differentiate the phenomenon? And is it worth making a map of? Is it something that’s interesting? To answer your question, no, I don’t think so. I think mapping things is usually good. It lets sunshine in, though I suppose there plenty of microbes that don’t like the sun.
Maps and interview from Everything Sings: Maps for a Narrative Atlas by Denis Wood, 2nd edition, Siglio, 2013, © the author and Siglio.
DENIS WOOD’s four decades of work as a geographer and independent scholar has influenced the creative and activist spirit of a new generation of critical cartographers, experimental and psycho-geographers, ecologically and politically conscious landscape architects and designers. His most well-known book, The Power of Maps, began as an exhibition Wood curated for the Cooper Hewitt National Design Museum in 1992 (and remounted the following year at the Smithsonian). Wood has since written numerous books that critique and investigate the political and social implications of mapmaking, including The Natures of Maps: Cartographic Constructions of the Natural World (University of Chicago, 2009) co-authored with John Fels, Rethinking the Power of Maps (Guilford, 2010) with Fels and John Krygier, Five Billion Years of Global Change: A History of the Land (Guilford, 2003). He is currently at work with Joe Bryan on Weaponizing Maps, a genealogy of US Army mapping of indigenous populations where counter-insurgency military measures have been used for U.S. interests abroad.
